Which choices change the map?
This chapter shows the map it produces, then how far each choice we tested moves it, how well it holds up against independent data, and how it combines with conservation value.
1. Karst intrinsic vulnerability (KIVI) at Mole Creek
The Karst Intrinsic Vulnerability Index (KIVI) is susceptibility (how karstified and how exposed the rock is) multiplied by connectivity (how much water drains in). It describes the karst itself, before land use or slope is applied.
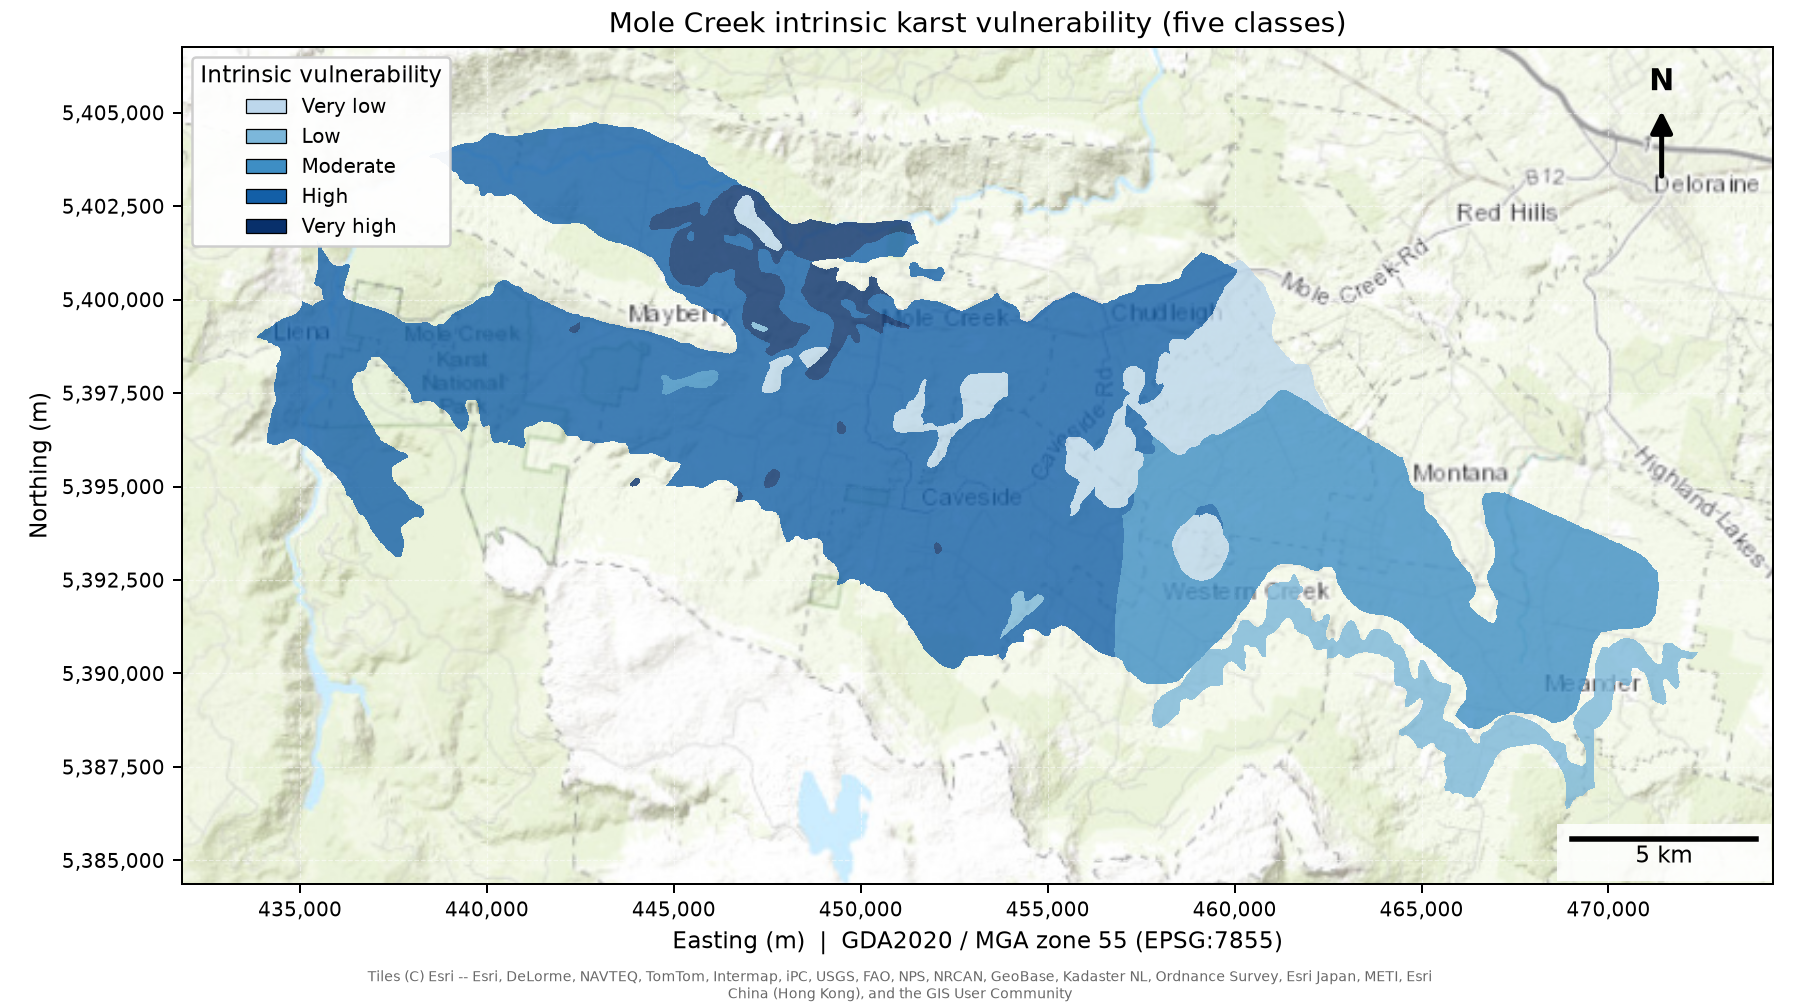
KIVI at Mole Creek (25 m): susceptibility × connectivity. Most of the karst is High (56%), with small Very high areas (5%) where exposed, strongly karstified karst sits low in a large catchment.
More than half of the Mole Creek karst (56%) has High KIVI, mostly across the west and centre, where the rock is strongly karstified. The highest class (Very high, 5%) is a small area in the north-west and north-centre where that rock is open to the surface and lies low in a large catchment. The eastern block is Moderate (25%), and the lowest classes are a narrow strip on the south-east edge (Low, 6%) and small patches of karst between other rock layers in the centre and east (Very low, 8%).
Covered and interstratal karst scores lower than exposed karst of the same category.
2. Relative risk at Mole Creek
Relative risk multiplies KIVI by land-use pressure and the slope multiplier. It uses LIST land use for 2021, with the scoring set out in the Methods.
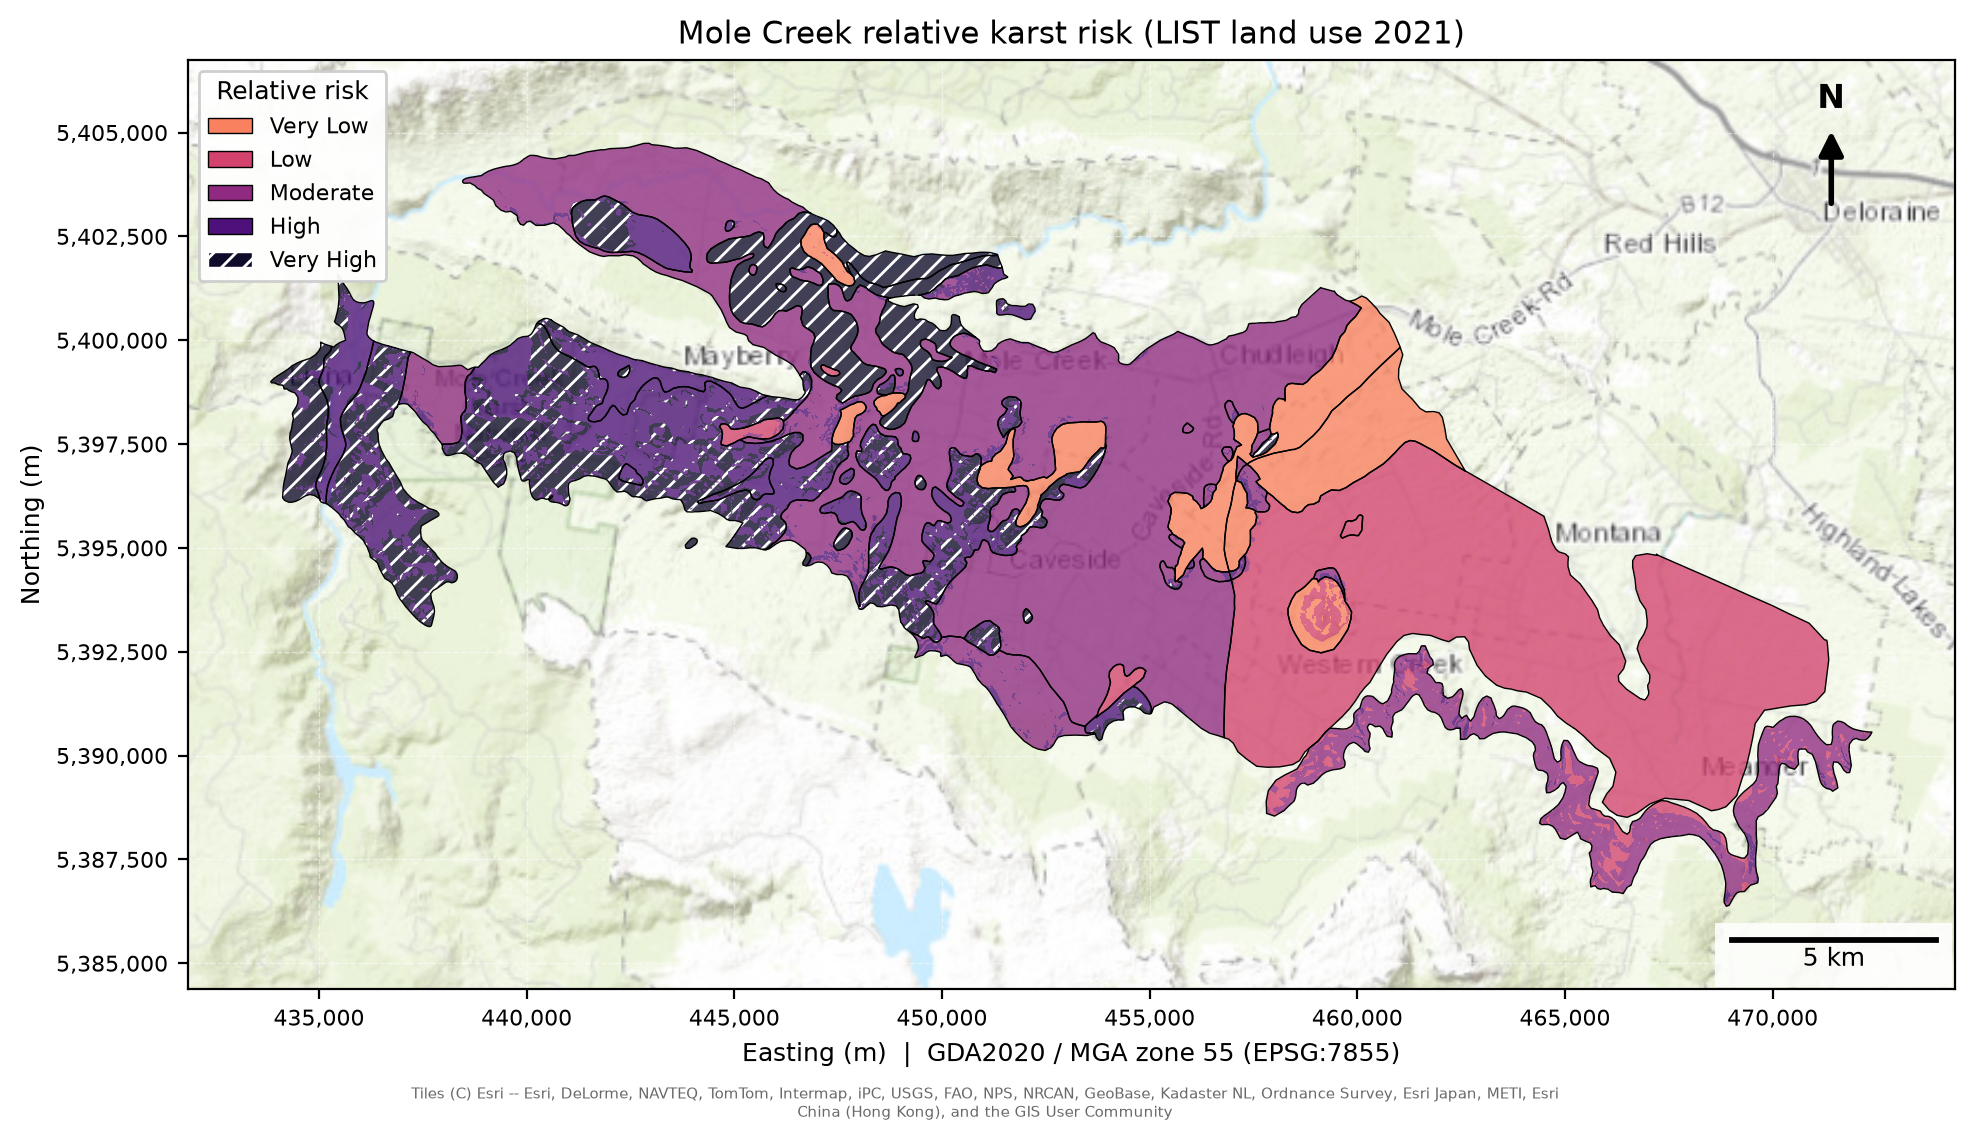
Relative karst risk at Mole Creek (25 m).
Risk is highest in the west. About four in five of the High (13%) and Very High (15%) cells lie in the western third of the study area, mostly on exposed karst and steeper ground. The centre is mostly Moderate (38%), and the east is mostly Low (26%) or Very Low (8%), where the karst is flat and covered by other rock. Land-use pressure is averaged over each named system, so inside the main Mole Creek system the pattern comes from the ground itself, while the small Chudleigh Hill system, which has higher pressure, is almost all Very High.
Most karst falls in the lower classes. This comes from the arithmetic: the score is the product of numbers below one, so it bunches towards zero, and a place has to score high on every ingredient to score high overall. The classes are therefore narrow (0.025 wide), and the colours show which places stand out from the rest of Tasmania’s karst.
3. Across Tasmania
The same model runs across the state at 100 m. The map below shows both results for Tasmania.
Interactive map of Tasmania: relative karst risk (low to high, ranked among the karst cells) and KIVI (five blue classes). Choose a layer in the layers menu, use the Mole Creek button to zoom in, click a karst system for its category, exposure, connectivity class, mean slope and mean risk, and switch on the springs. Grey land is outside the mapped karst.
Across the state, the shares of the karst cells in the KIVI classes are Very low 18%, Low 4%, Moderate 22%, High 47% and Very high 9%. The shares in the relative risk classes are below, with Mole Creek for comparison.
| Class | Score up to | Mole Creek (25 m) | Tasmania (100 m) |
|---|---|---|---|
| Very Low | 0.025 | 8.1% | 37.7% |
| Low | 0.05 | 26.0% | 24.8% |
| Moderate | 0.075 | 37.6% | 24.5% |
| High | 0.10 | 13.0% | 8.3% |
| Very High | above 0.10 | 15.2% | 4.7% |
Share of the karst cells in each class.
4. Which systems rank highest
Statewide, mean risk per named karst system (100 m). Only the 260 systems with at least 20 cells are ranked, because the top of an unfiltered list is a few systems of 2 to 11 cells.
| Rank | System | Atlas category | Mean risk | Cells |
|---|---|---|---|---|
| 1 | Flowery Gully | A | 0.168 | 120 |
| 2 | Doctors Rocks | B | 0.164 | 71 |
| 3 | Savage River Mine | B | 0.153 | 26 |
| 4 | Gunns Plains | A | 0.146 | 2,998 |
| 5 | Nabageena | B | 0.136 | 103 |
| 6 | Wynyard | C | 0.135 | 173 |
| 7 | Port Hills | B | 0.133 | 57 |
| 8 | Irishtown - Sedgy Creek (2) | B | 0.131 | 106 |
| 9 | Lorinna | B | 0.114 | 169 |
| 10 | Puncheon | B | 0.114 | 132 |
| 33 | Mole Creek | A and B | 0.074 | 24,260 |
| 52 | Meander - Western Creek | D | 0.055 | 1,507 |
Mole Creek (Chudleigh Hill) has only 13 cells at 100 m, so it is left out of the ranking. 132 karst polygons were too small for a single 100 m cell, have no connectivity score and are left out.
5. How much do the choices matter?
Each choice was changed one at a time and the result compared with the main map. The measure is the rank correlation over the mapped karst cells.
| Group | Choice | Mole Creek (25 m) | Tasmania (100 m) |
|---|---|---|---|
| Scale | 2 m DEM | 0.99 | – |
| Scale | 100 m DEM | 0.89 | – |
| Data | DEA land cover | 0.98 | 0.84 |
| Method | Four ingredients added | 0.98 | 0.70 |
| Method | Six ingredients added | 0.55 | 0.82 |
| Method | Slope, flatter = higher | 0.83 | 0.96 |
| Method | Slope, 10 degree ceiling | 0.99 | 0.99 |
| Method | Exposure removed | 0.91 | 0.96 |
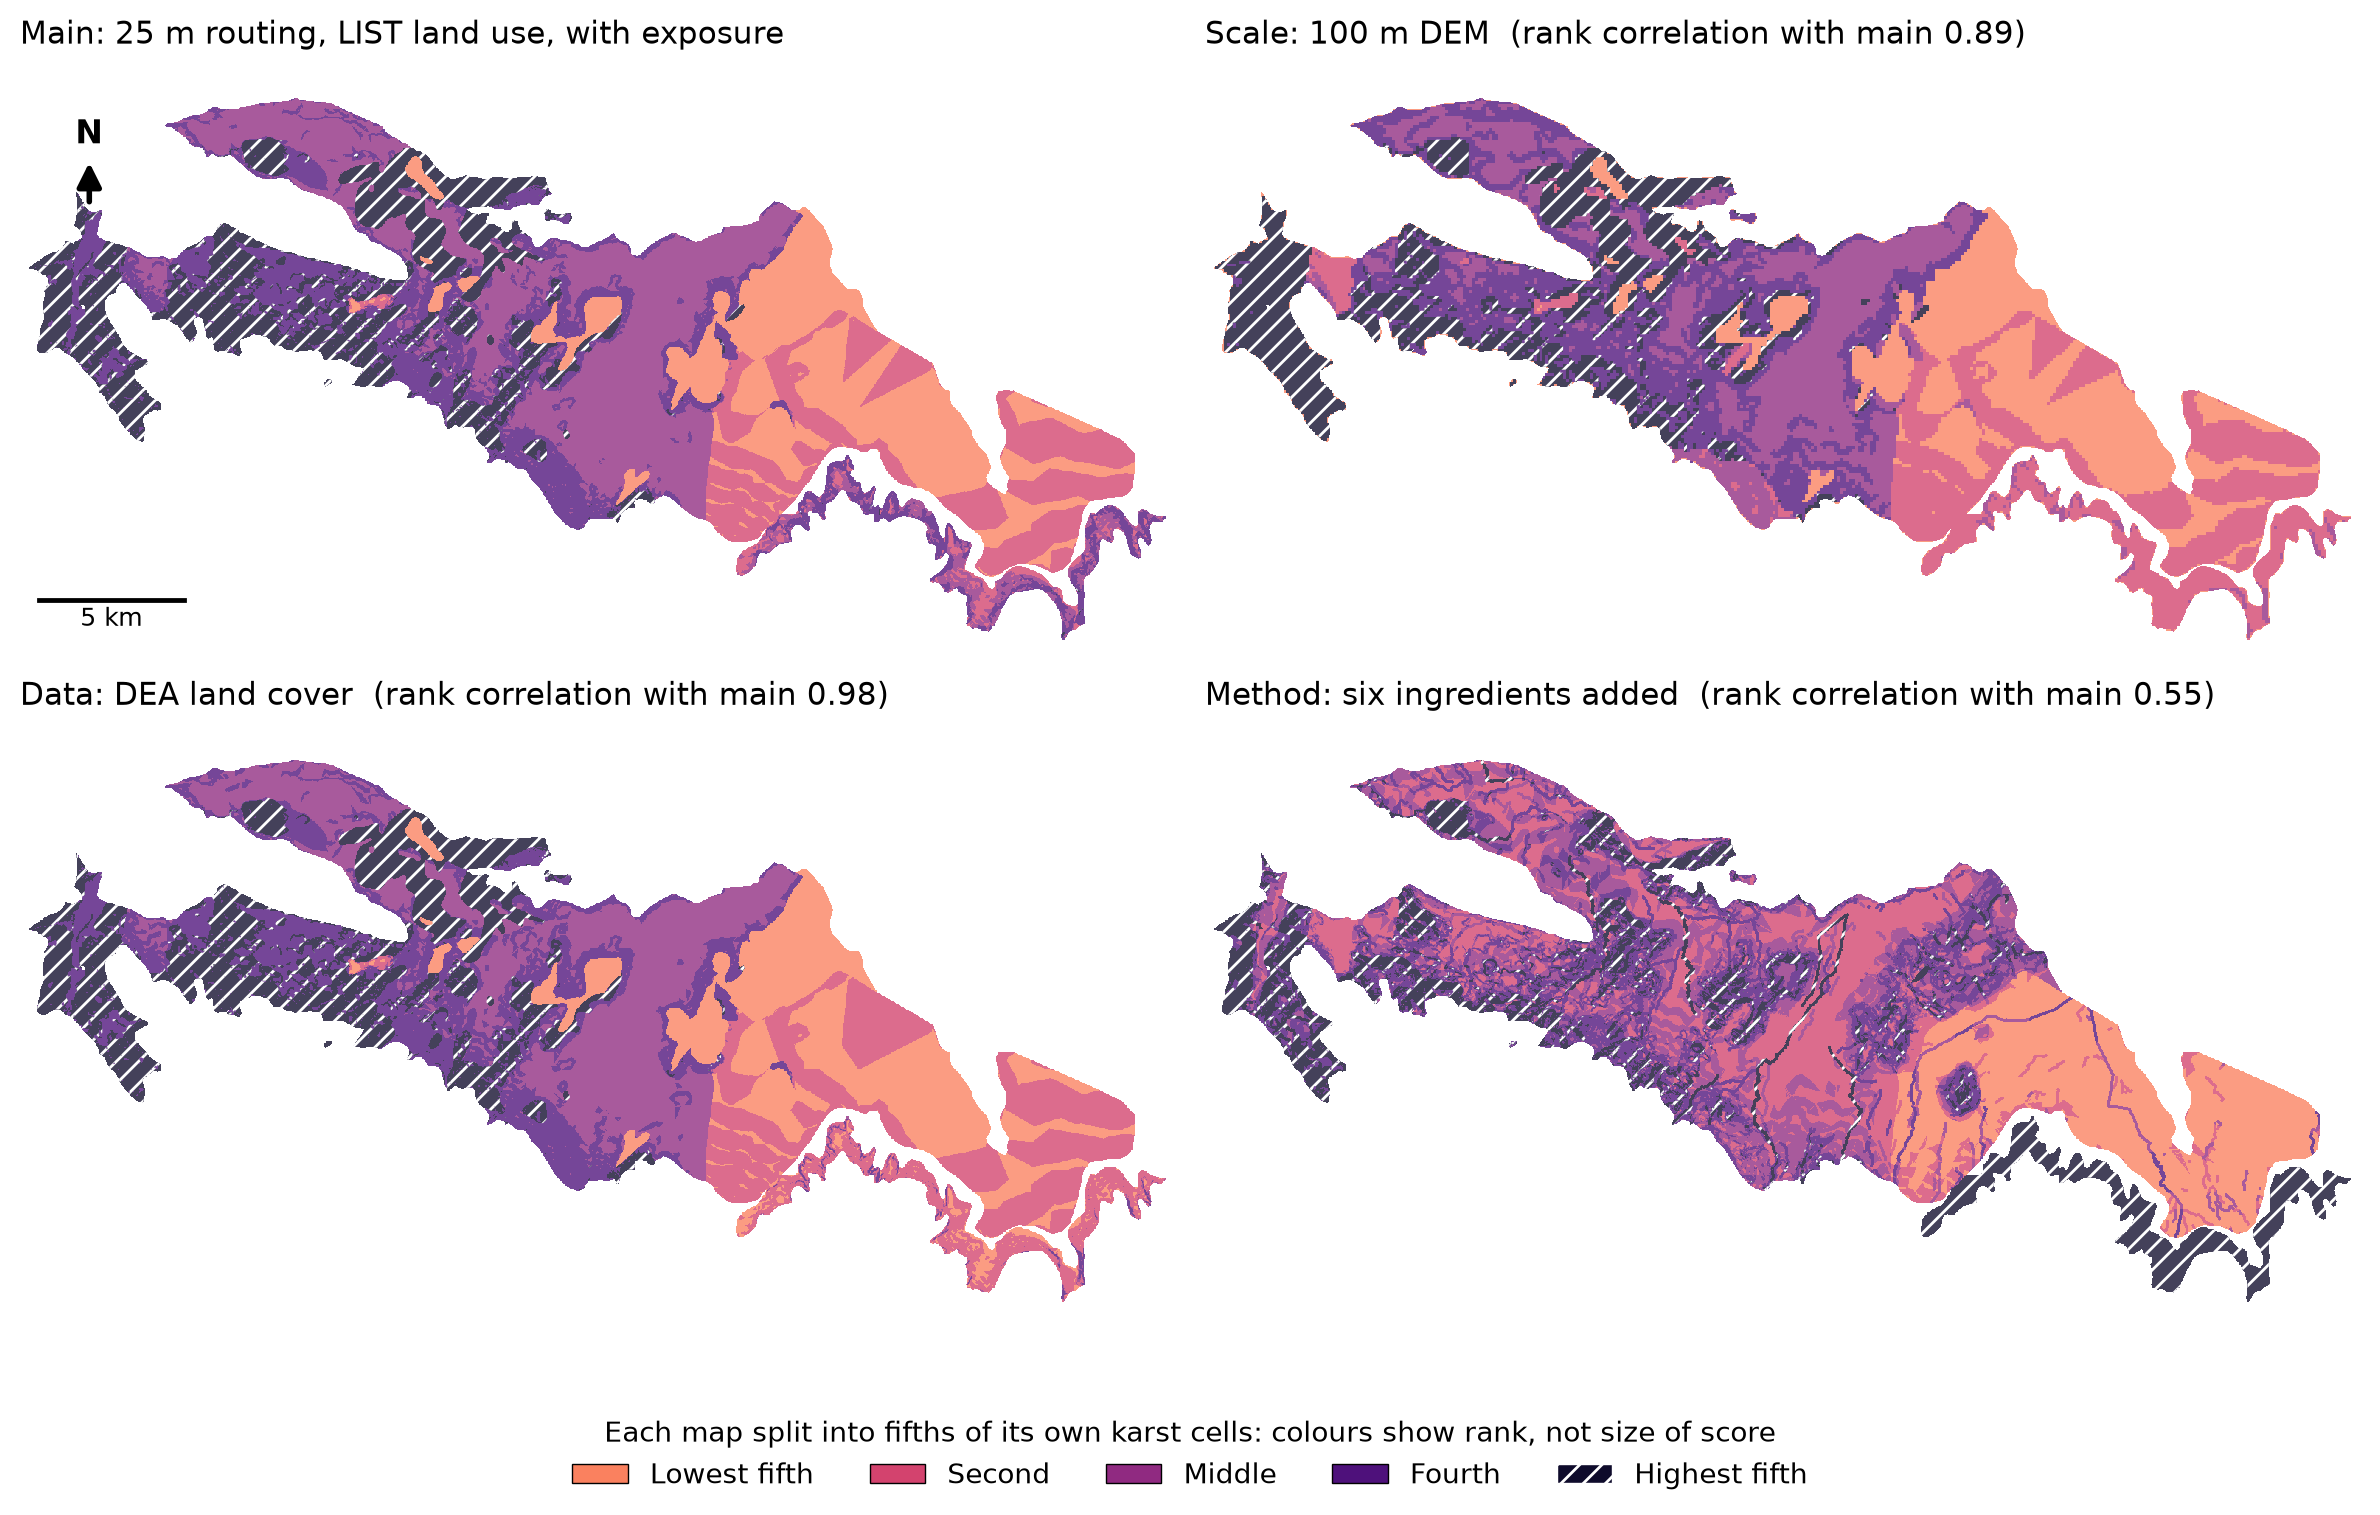
The main map and one change on each axis. Each map is split into fifths of its own karst cells, so the colours show each cell’s rank.
Scale. Routing water on a 2 m elevation model gives almost the same map as 25 m (0.99; 88% of polygons fall in the same connectivity class). The 100 m grid changes it more (0.89), mainly because small polygons are covered by only a few cells. For risk, mean risk over the Mole Creek karst is 0.062 at 25 m and 0.074 at 100 m, and the three named areas keep the same order.
The same comparison on KIVI alone (Stage 8b) gives a correlation of 0.88 between the 25 m and 100 m surfaces over the Mole Creek core, with 61% of cells at exactly the same score. The 100 m run scores Mole Creek higher on average (0.41 against 0.34), mostly in the west and north-centre, while the east and the Meander – Western Creek system are almost identical.
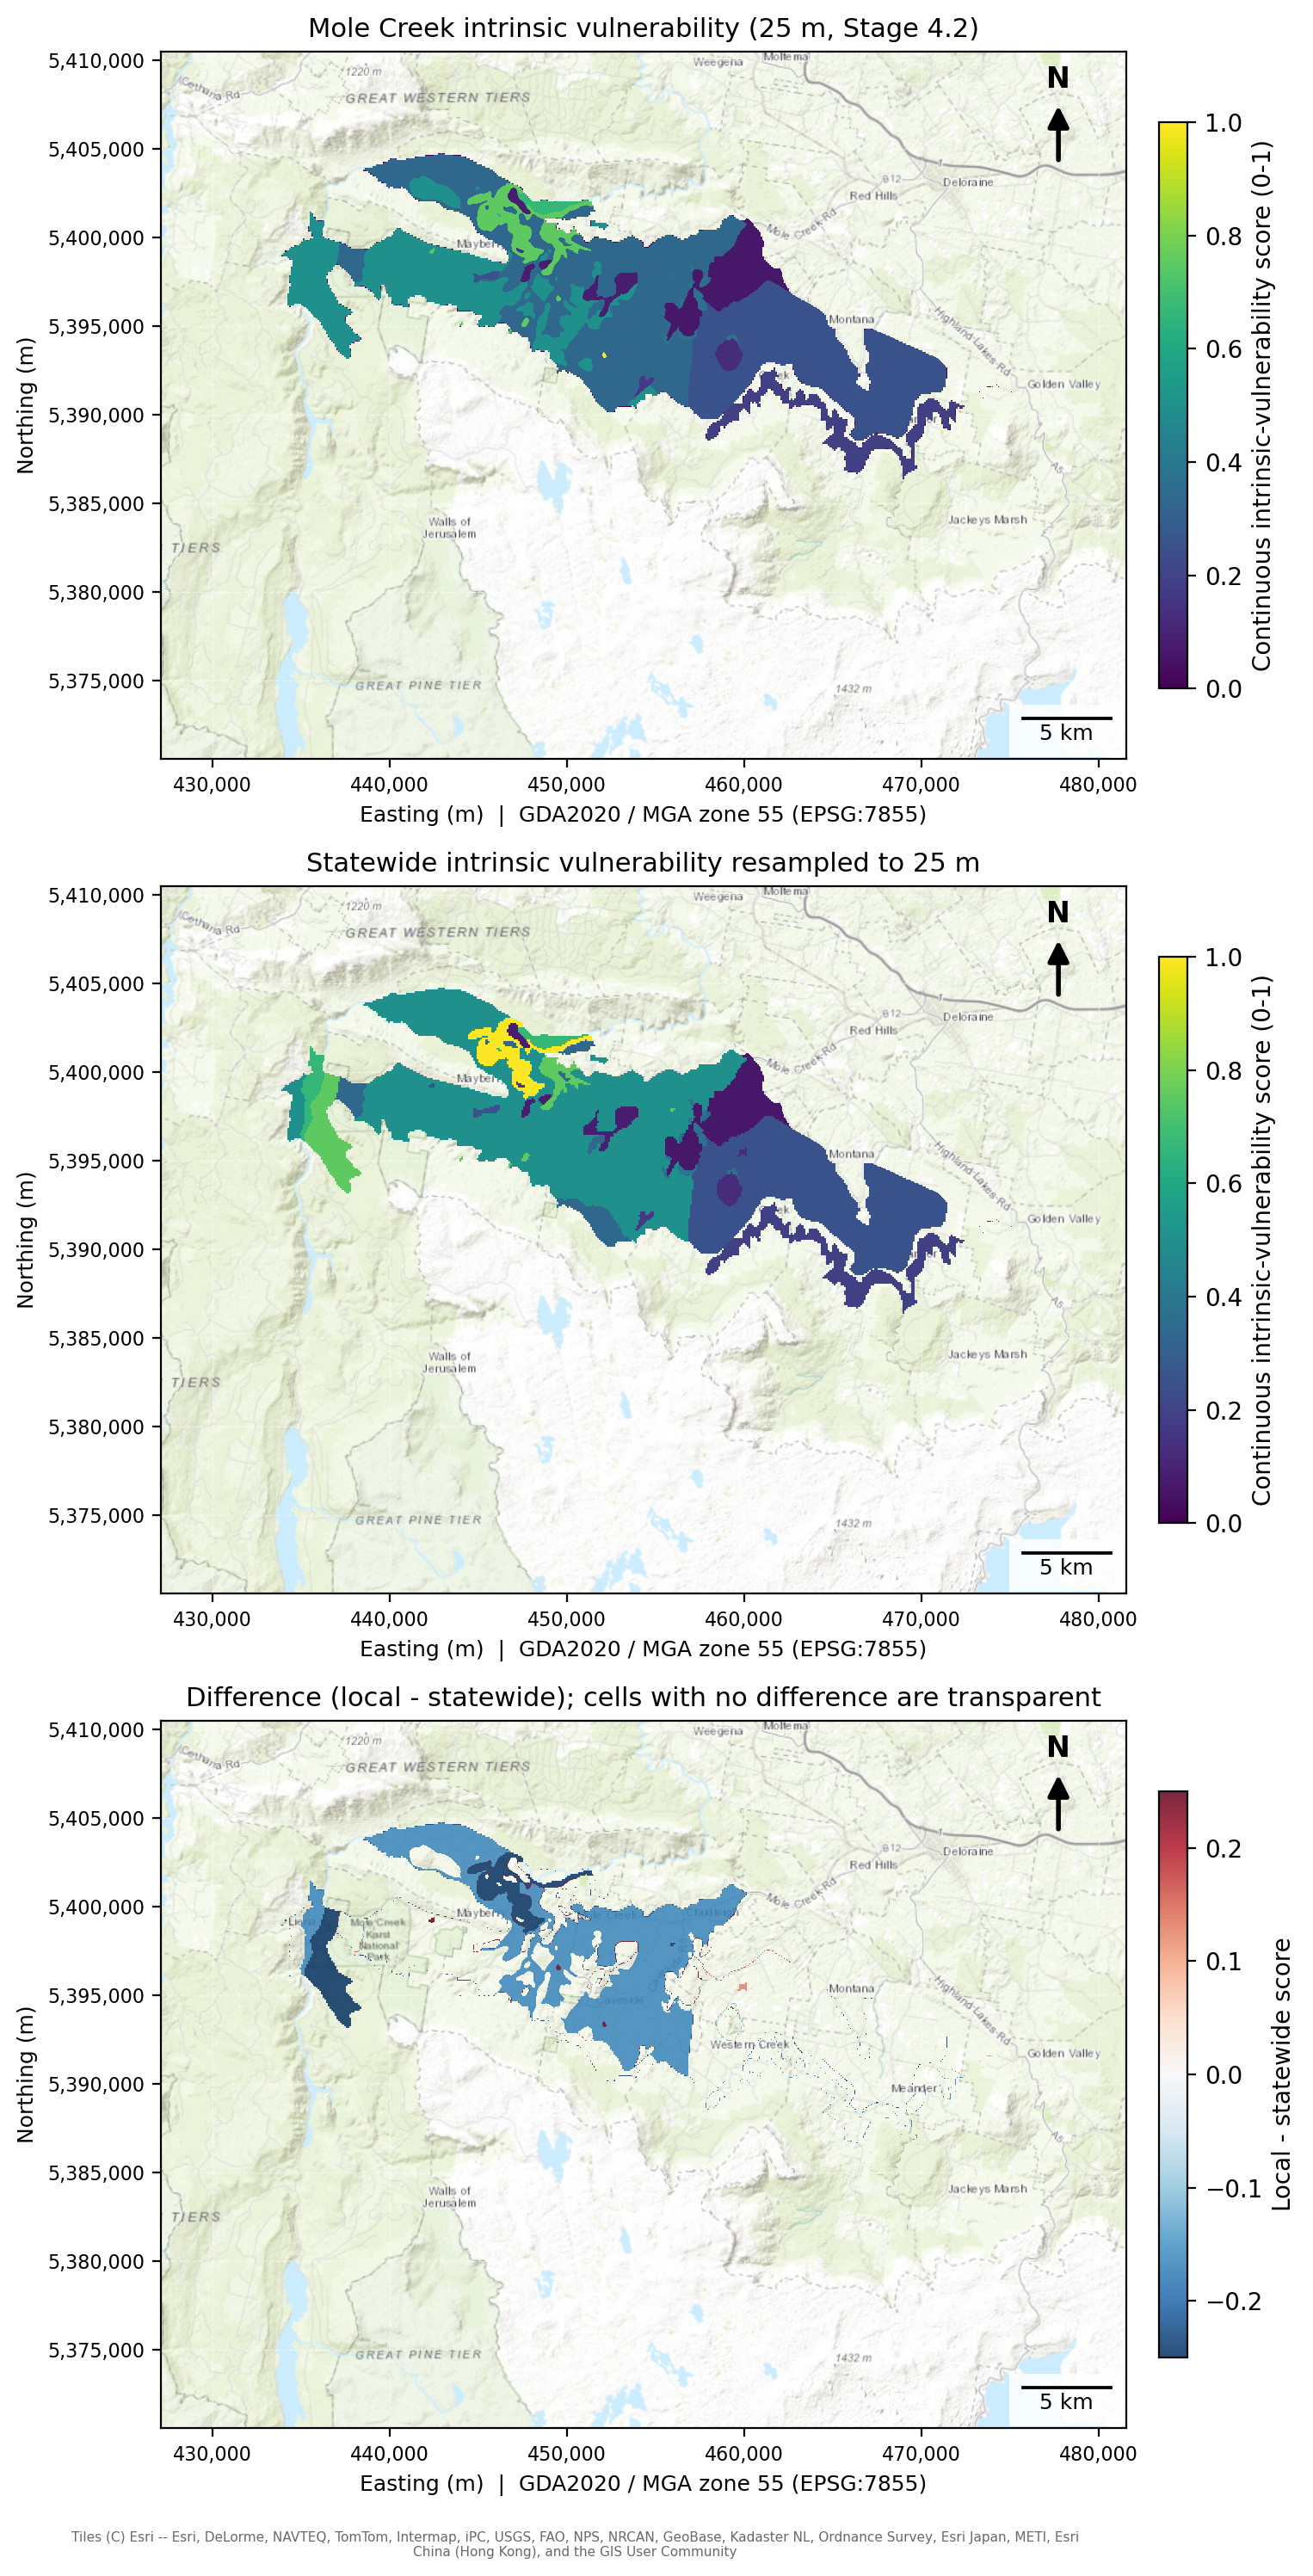
KIVI at Mole Creek from the 25 m run and the 100 m statewide run, and the difference (25 m minus 100 m).
Data. Replacing the Tasmanian land-use layer with the national DEA land-cover layer has little effect on the Mole Creek ranking (similarity = 0.98) but produces greater differences across the state (0.84). DEA gives a higher mean risk at Mole Creek (0.095 against 0.062).
Method.
Adding the four ingredients instead of multiplying keeps the Mole Creek ordering (0.98) and changes the state’s (0.70). It also puts every cell in the top class, because a sum scores about 0.4 to 0.5 where the product scores about 0.06.
A six-input weighted sum, closer to a literature-style index, gives a very different Mole Creek map (0.55). Catchment flags, watercourses and rainfall stood in for soil cover, depth to groundwater and sinkhole density, which have no statewide Tasmanian data.
Slope direction matters at Mole Creek (0.83) and hardly at all statewide (0.96). Flipping the rule (flatter = more vulnerable, as in one published method) is the change tested. Lowering the slope ceiling from 30° to 10° barely changes the ordering (0.99).
Removing exposure changes the map by about as much as moving to a 100 m grid (0.91 at Mole Creek, 0.96 statewide).
Smaller choices. Four further judgement calls were tested at Mole Creek (Stage 9).
Averaging pressure over each named system, compared with raw cell pressure, gives the biggest change (r = 0.29). The distance used to join polygons in a system makes no difference there.
Doubling the weight of susceptibility, connectivity or pressure in turn keeps the pattern (r = 0.93 to 0.97) and the order of the named areas.
Scoring natural land 0 on the DEA version halves mean risk (0.095 to 0.044) and keeps the pattern (r = 0.99). A milder 1:2 contrast raises mean risk to 0.12 with the same ranking (r = 0.9997).
Adding the Atlas rainfall field leaves the map unchanged (r = 1.000), because rainfall varies by about 11 mm across the karst.
Land-use change moves the level of risk and leaves the pattern in place
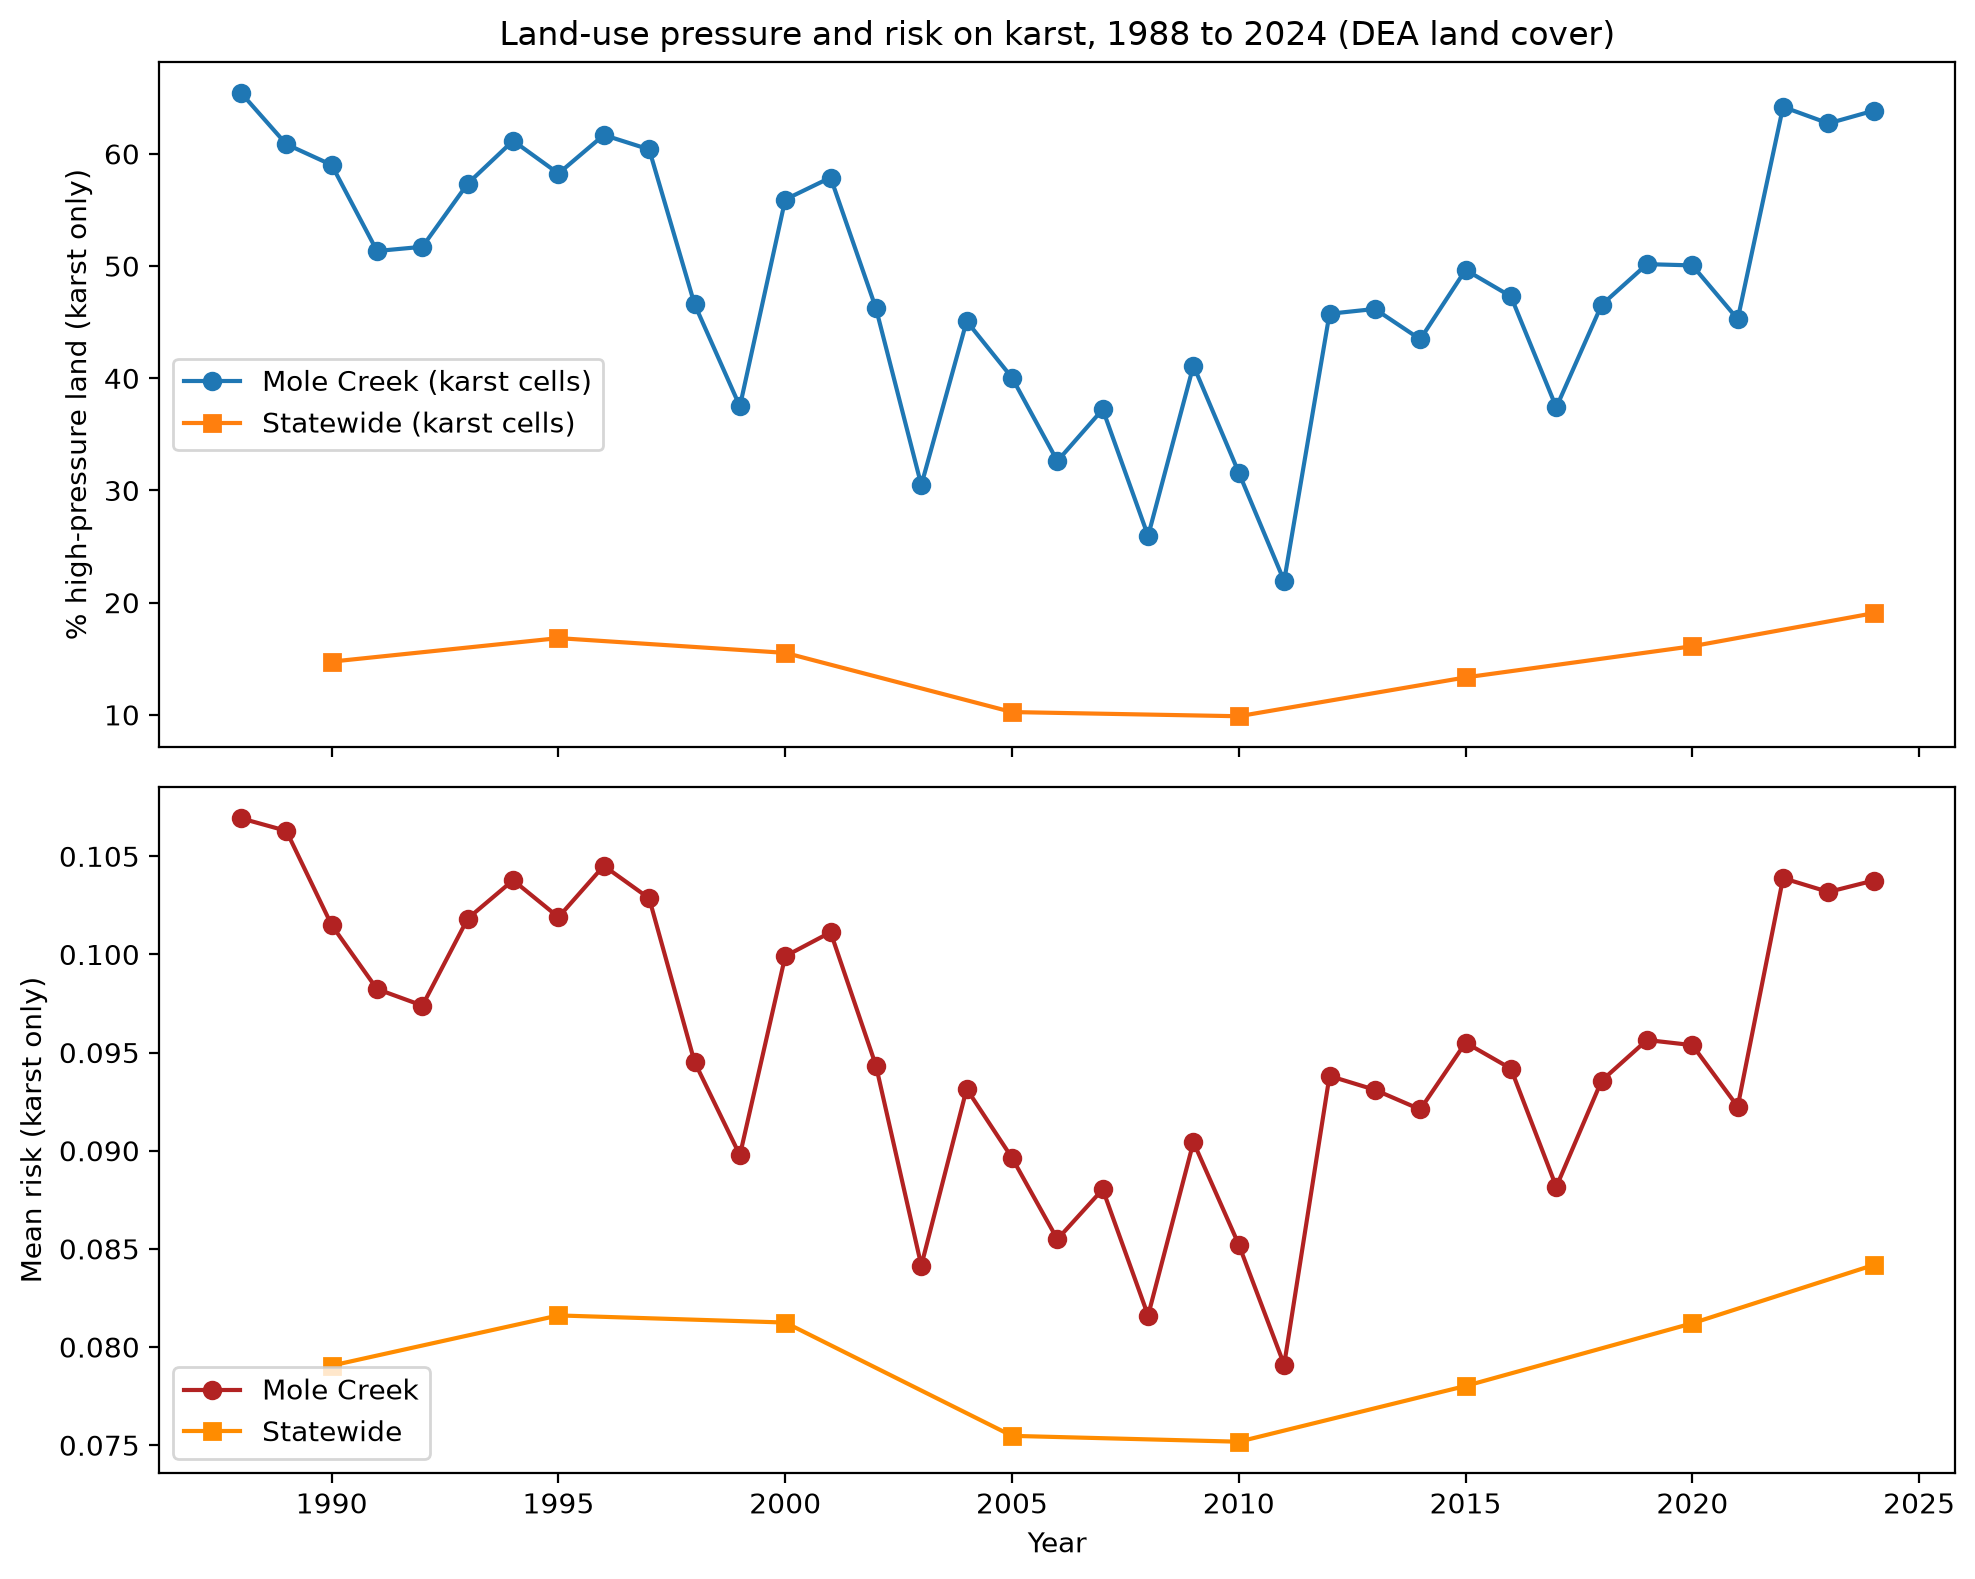
High-pressure land and mean risk on karst, 1988 to 2024, using DEA land cover (the only source with an annual series).
At Mole Creek the share of high-pressure land on the karst swings from 65% (1988) to 22% (2011) and back to 64% (2024), while the pattern of risk stays almost fixed (a correlation of at least 0.9998 between years). Statewide the share is lower, between 10% and 19%. The main map uses LIST land use for 2021.
6. Checks against independent data
The one independent check is mapped springs (CFEV groundwater-dependent ecosystems), as there is no contamination record to test against. Each spring within a set distance of mapped karst takes the intrinsic score of its nearest karst polygon. The average score for the systems that hold springs is then compared with random draws of karst, weighted by area.
| Distance limit | Systems with springs | Their average score | Karst average | Percentile of the random draws |
|---|---|---|---|---|
| Within 0 m | 17 | 0.50 | 0.34 | 99.9 |
| Within 250 m | 22 | 0.45 | 0.34 | 99.5 |
| Within 500 m | 24 | 0.44 | 0.34 | 99.3 |
| Within 1000 m | 28 | 0.44 | 0.34 | 99.6 |
Springs sit in karst that scores well above the average, at about the 99th percentile, and the result holds when warm and mound springs are removed. Adding exposure raised this from about the 96th percentile. The check is a weak one: springs mark where water leaves the karst, the test rests on 12 to 28 systems, and springs are probably mapped using the same karst knowledge that feeds our scores.
7. KIVI and conservation value
The Conservation of Freshwater Ecosystem Values (CFEV) project rated each karst area as Moderate, High or Very High in Integrated Conservation Value (ICV). We set the ICV layer on the same 100 m grid as KIVI and compared the two for the 409,382 karst cells that have both (4,094 km²). Across the state, ICV is Moderate on 27% of these cells, High on 46% and Very High on 27%.
Cells with higher KIVI (0.5 and above) are more often Very High conservation value (48% of them) than cells with lower KIVI (6%). Most lower-KIVI cells are High (71%).
We then grouped KIVI into Lower, Middle and Higher, and combined each group with the ICV class into four provisional priority classes. Priority 1 is Higher KIVI with Very High ICV. Priority 2 is Higher KIVI with High ICV, or Middle KIVI with Very High ICV. Priority 3 and 4 cover the remaining combinations, with Priority 4 the lowest.
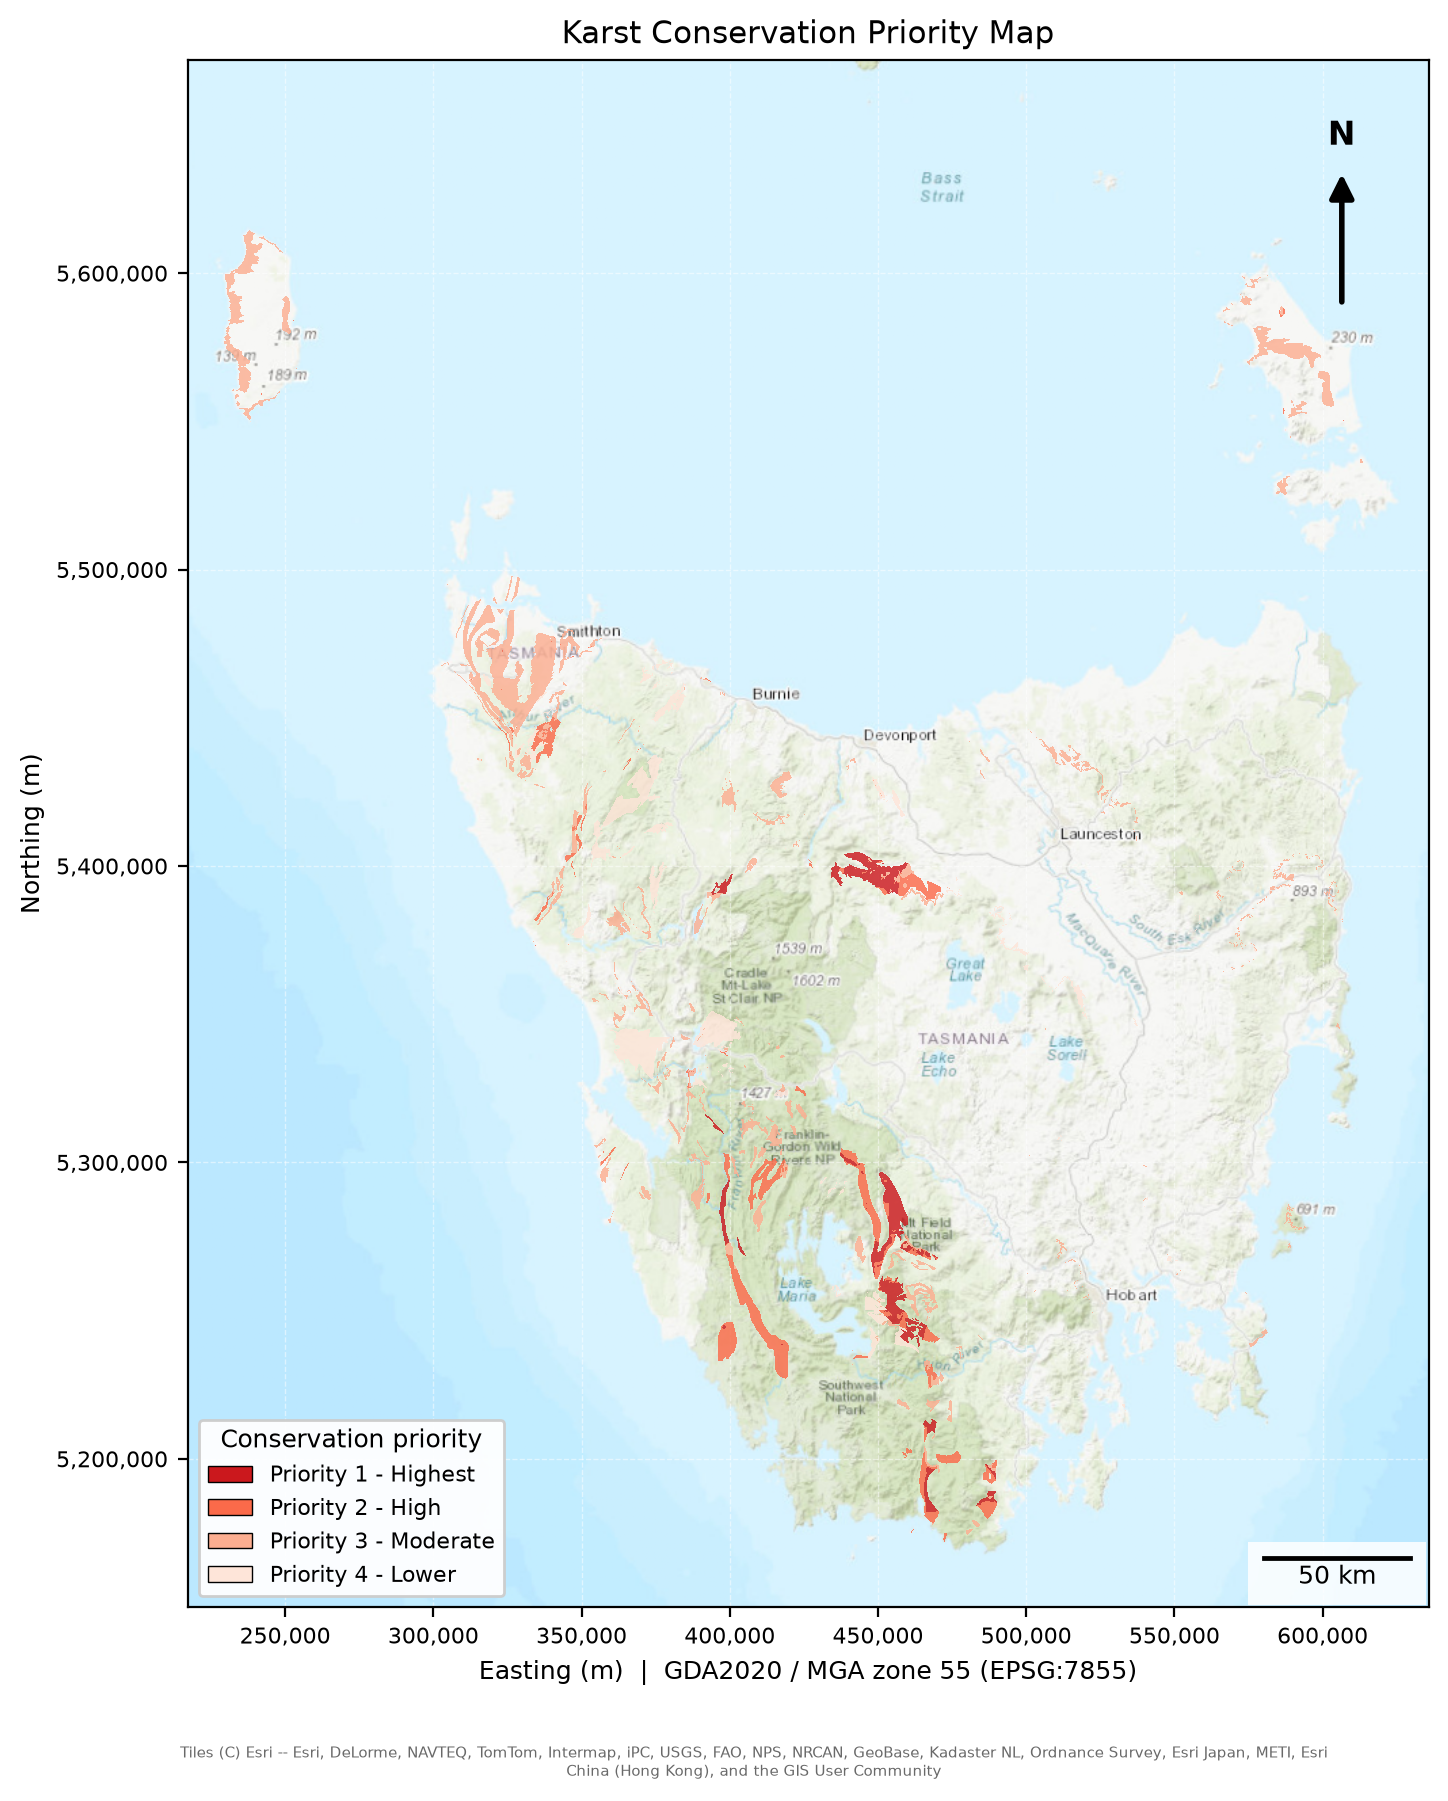
Karst conservation priority (100 m): KIVI combined with CFEV Integrated Conservation Value.
| Priority | Share of karst cells | Area (km²) |
|---|---|---|
| 1 Highest | 12.8% | 524 |
| 2 High | 19.3% | 791 |
| 3 Moderate | 47.3% | 1,936 |
| 4 Lower | 20.6% | 843 |
Share of the karst cells with both KIVI and ICV.
Priority 1 concentrates in a few large systems: Mole Creek (146 km², 61% of its area, all of it Very High conservation value), Junee–Florentine (140 km², 74%), Mt Anne–Upper Weld (112 km², 83%), and smaller systems such as Gordon–Sprent and Mt Cripps that are almost entirely Priority 1. The class boundaries are provisional, and the map ranks places for attention. It adds conservation value to the KIVI picture and gives no measure of contamination.