Background
Water. We all know its importance to life, how critical it is to keep it clean and contamination free for human, non-human and environmental health. But have you ever thought about what happens to it under the ground? There are many places in Tasmania where water has turned the subterranean depths into a sparkling, mysterious, stunningly beautiful wonderland, silent except for the musical dripping of water or the gurgling of the crystal clear streams. In other places there are waterfalls and underground rivers flowing into the dark where only experienced cave divers dare to go.
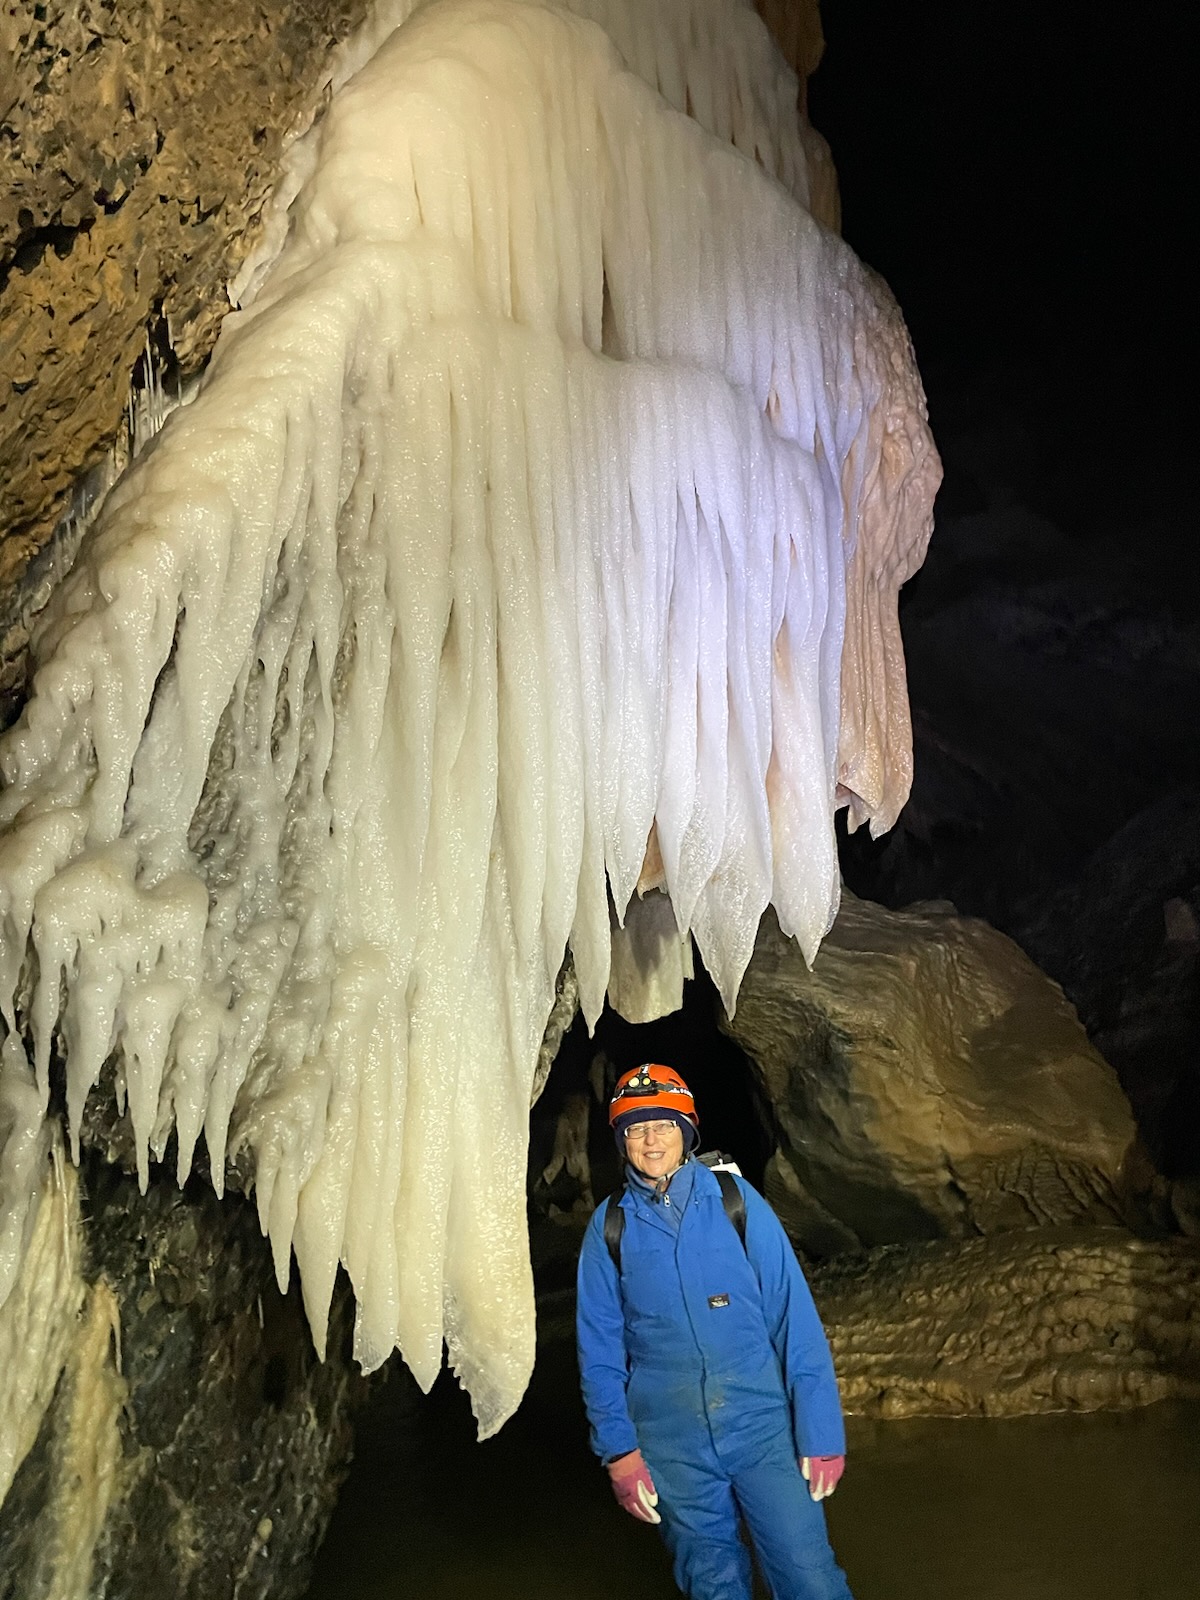
Appreciating water’s sculpture in a cave at Mole Creek.
Caves are also home to a variety of fauna, some dwell only in caves while others just take advantage of their shelter.

Endemic Tasmanian cave spider Hickmania troglodytes
Dissolving rock
The landscape in which caves form is called karst, which often forms distinctive landforms on the surface as well, such as disappearing streams, sinkholes, arches and rugged rock features. It forms in geology with a high degree of rock solubility. In Tasmania it is mostly in limestone and dolomite, with some in magnesite in the north west. Water has an integral relationship with karst, flowing through it and round it, eroding it and forming it, making it particularly vulnerable to changes in water quality and hydrology.
Water quality doesn’t just affect karst features and cave dwellers, karst aquifers and springs are an important source of both agricultural and drinking water around the world including Tasmania. Karst hydrological systems are particularly vulnerable to contamination because instead of surface water filtering through surface soil layers and infiltrating bedrock and aquifers very slowly, it rapidly flows into and through karst systems, potentially contaminating and damaging the cave formations and contaminating the underground aquifers or the springs where it reappears. This means that risk to karst and risk to groundwater go hand in hand.
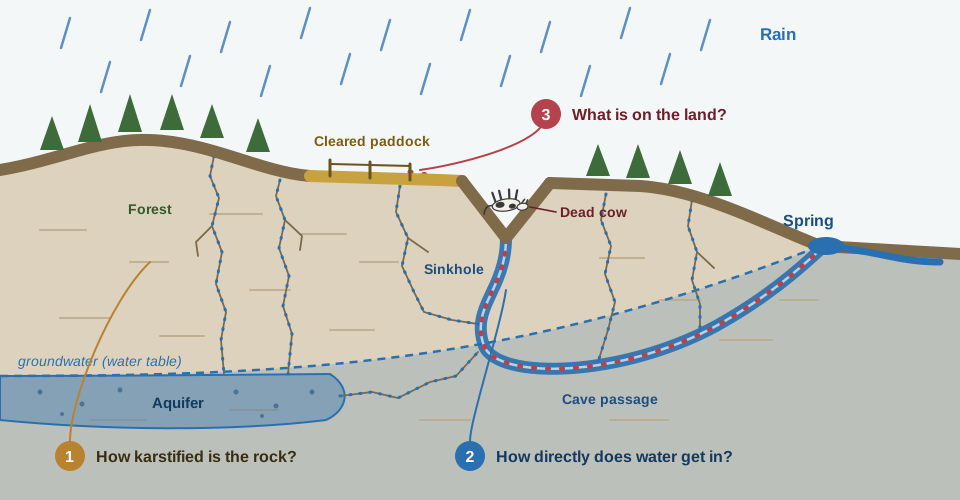
Water enters at a sinkhole and leaves at a spring. Anything it picks up on the way (red dots) travels with it. The three numbers are the three questions our index asks of every map cell. Diagram drawn by Claude (Anthropic, generative AI) from the authors’ description and checked by the authors.
Small, scattered, easy to overlook
There is about 4,100 km² of karst mapped in Tasmania which covers 6% of the state, in patches from the north-west to the south. It is a small share of the land, but it carries springs and other ecosystems that depend on it. Some is in protected areas but other areas such as Mole Creek have varied and active land use including agriculture, forestry, mining, roads and buildings. Karst landscapes are more vulnerable to erosion and collapse which adds a further importance to identifying and assessing them.
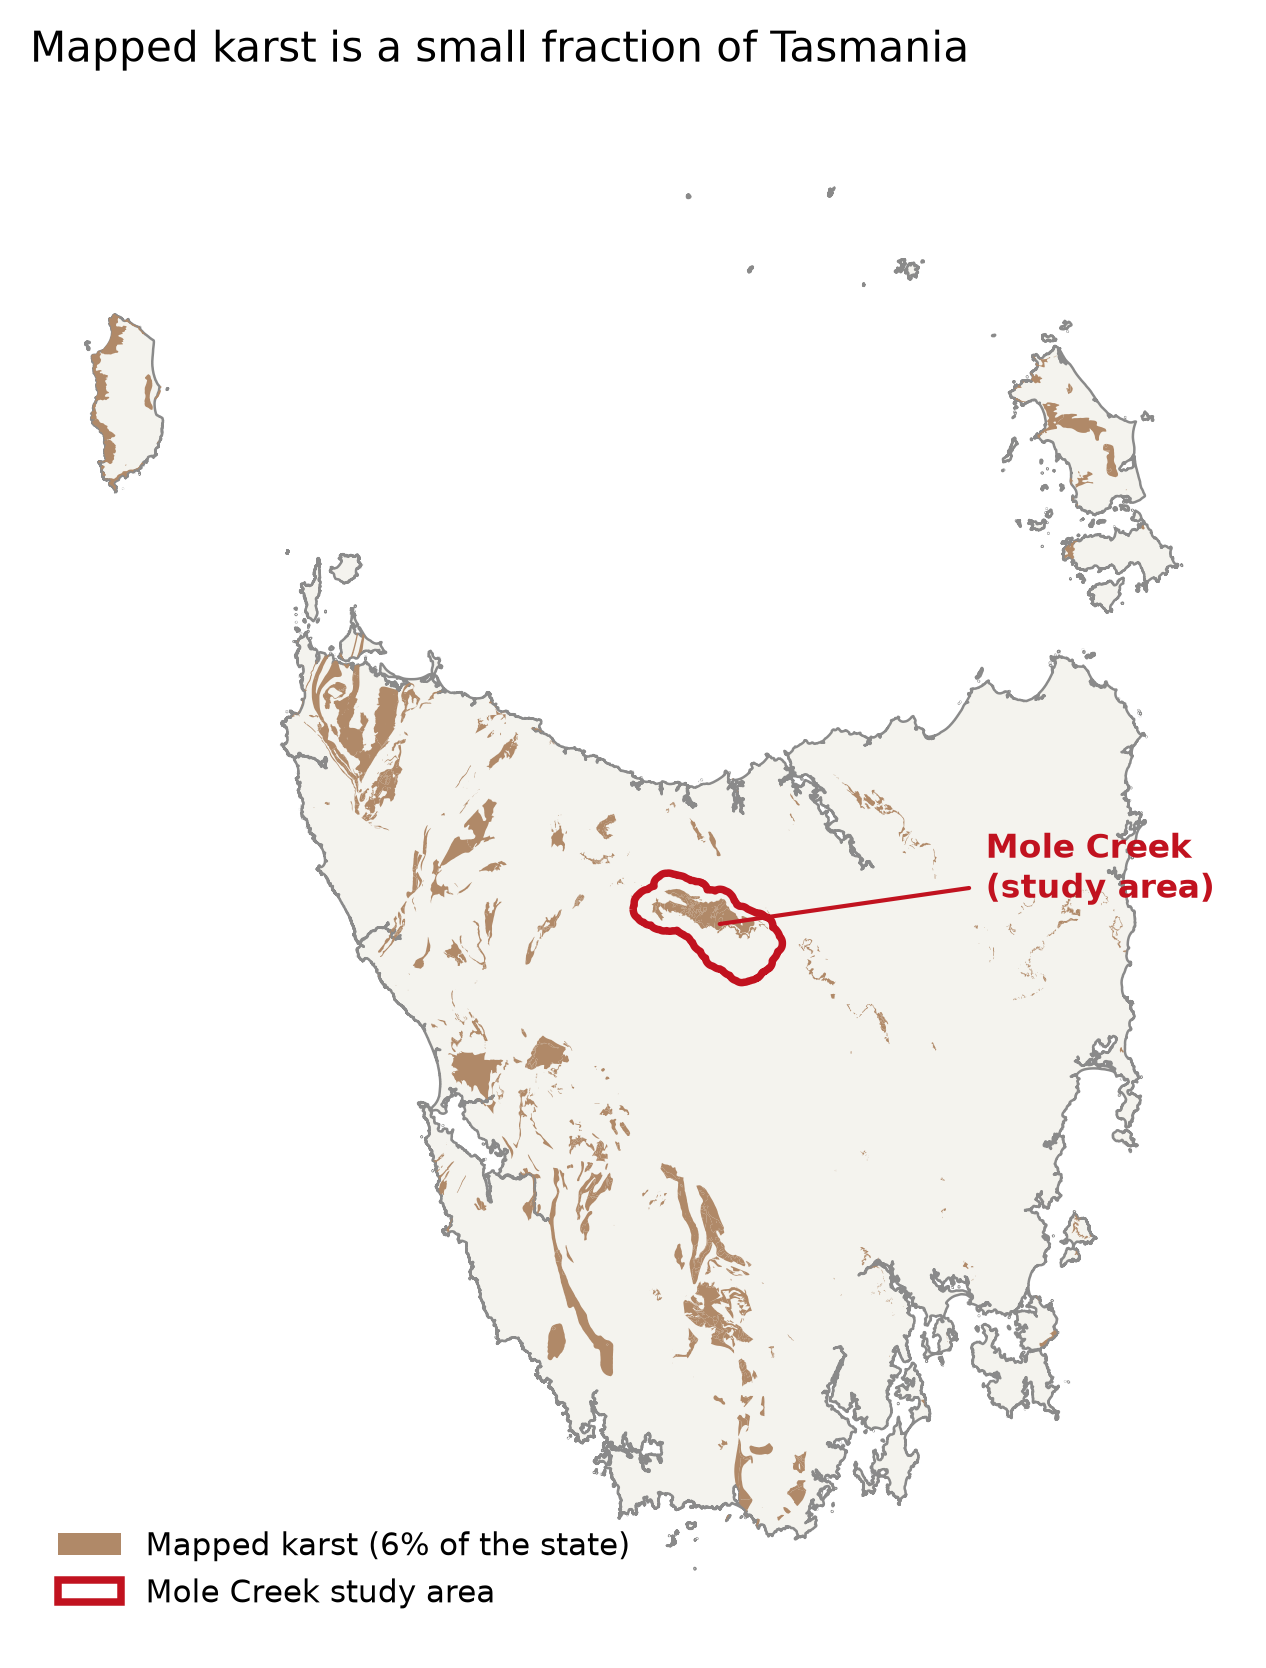
Mapped karst is scattered across just 6% of Tasmania. Mole Creek, an actively farmed karst area in the north, is this project’s study site.
Tasmanian Karst Mapping and Assessment
In 1995, An Atlas of Tasmanian Karst was produced by Kevin Kiernan showing known carbonate rock areas and their catchments on 1:100,000 maps with some information attached (Kiernan, 1995). These were digitised in 1996 and edited in Version 2 as a shapefile by Chris Sharples, with Version 3 being further edited to include some further information and karst polygon boundaries upgraded (Sharples, 2003).
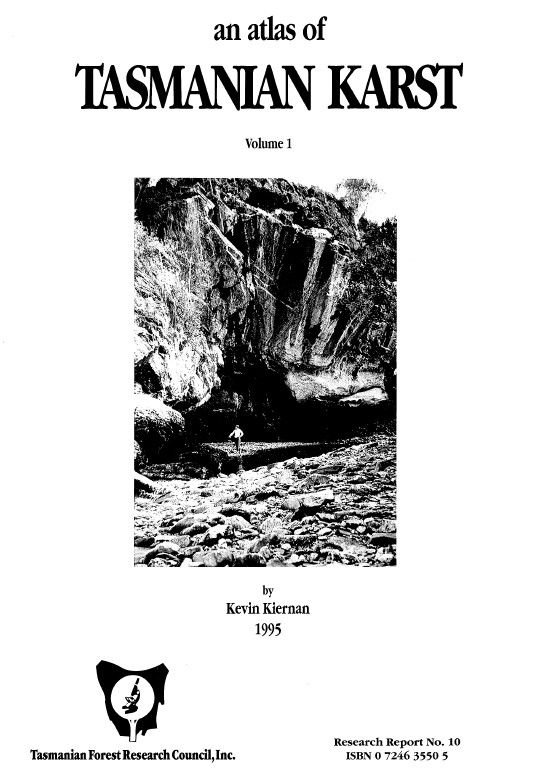
The cover of the first version of An Atlas of Tasmanian Karst by Kevin Kiernan (1995).
Conservation Value
The Conservation of Freshwater Ecosystem Values (CFEV) project used reviewed and updated spatial data from the Karst Atlas Version 3 while assessing the conservation management priorities for all freshwater ecosystems in Tasmania which included karst (DPIPWE, 2014). The result, completed in 2005, was the CFEV Karst – Integrated Conservation Value (ICV) spatial layer which combines measures of Naturalness, Representativeness and Distinctiveness to give a score of medium, high or very high conservation value and which can be viewed interactively on the LISTmap here: https://
Mapping, conservation value, but what about vulnerability?
The CFEV work gives a measure of conservation value and conservation management priority, but not of intrinsic vulnerability, which we define as vulnerability to groundwater contamination and/or physical karst damage. It depends on characteristics of the landscape and the pathways connecting the surface to groundwater. Because these factors vary spatially, vulnerability is commonly represented as a spatial index, in which several characteristics are mapped, scored and combined to produce a relative measure of vulnerability. The Tasmanian Conservation of Freshwater Ecosystem Values (CFEV) framework provides measures of conservation value and management priority, but does not directly assess intrinsic karst vulnerability as defined here.
Existing approaches
The heterogeneity of karst and availability of data sets has led to a range of methods developed, with different methods often giving different results for the same area. A systematic review identified scale and parameter transferability as key dimensions distinguishing these methods (Iván & Mádl-Szőnyi, 2017). In 2024, Moreno-Gómez et al outlined 12 of the methods including two of the earliest methods specifically focusing on karst: EPIK – Epikarst, Protective cover, Infiltration conditions and Karst network development (Doerfliger et al, 1999), and COP – Concentration of flow – Overlying layers – Precipitation method (Vias et al, 2006).
These are just some of the parameters that have been used in karst groundwater vulnerability methods in different combinations: Rock type, soil cover, infiltration, soils, epikarst, karstification, slope, vegetation, topography, elevation, conductivity, aquifer type. The definition and treatment of each parameter also varies from method to method (Moreno-Gómez et al, 2024) but most of them combine some measure of flow concentration, karst cover and karst development in some way.
Challenges
Scale: Parameters developed for one karst system do not necessarily transfer directly to another (Moreno-Gómez et al., 2019). Detailed hydrological modelling, such as flow routing using a 2 m digital elevation model, can capture fine-scale patterns at a local site but is difficult to apply consistently across an entire state. This creates a trade-off between local detail and statewide coverage, requiring methods and spatial resolutions appropriate to the scale of the assessment.
Data: Data availability is a fundamental limitation of karst vulnerability mapping (Ollivier et al., 2019). For example, freely available statewide land-cover products from Digital Earth Australia (DEA) may not distinguish between pine plantations and native forest, despite their potentially different implications for land-use pressure. Tasmania-specific datasets from the Land Information System Tasmania (LIST) can provide more detailed local information but are more complex to process and are not directly transferable beyond Tasmania.
Objective
This project aimed to develop and evaluate a reproducible, scalable Python workflow for mapping relative karst vulnerability and associated land-use and conservation priorities in Tasmania. Specifically, we aimed to:
Develop a Karst Intrinsic Vulnerability Index (KIVI) adapted to available Tasmanian data using an EPIK-style framework to represent karst susceptibility and potential hydrological connectivity.
Build and refine the method at Mole Creek on a 25 m grid, then apply it statewide on a 100 m grid and compare the outputs at Mole Creek at each resolution.
Test the sensitivity of vulnerability and risk patterns to key data and modelling choices including parameter dataset, parameter combinations and weighting.
Combine intrinsic vulnerability with land-use pressure to map relative risk and compare the changes across a 10 year period.
Combine vulnerability with the Conservation of Freshwater Ecosystem Values Integrated Conservation Value (CFEV ICV) to give a conservation-vulnerability priority map
Mole Creek was selected as the test area because it contains a high concentration of mapped karst features, has varied and active land use, has been studied previously, and is accessible for ground truthing. The statewide application demonstrates the workflow’s broader coverage, while the resolution, data, and method comparisons show how modelling choices affect the resulting maps and their interpretation.
The path
Build a relative karst vulnerability index that can scale from local to statewide. Test how different inputs and combination methods change the result, map land-use risk and conservation priorities.
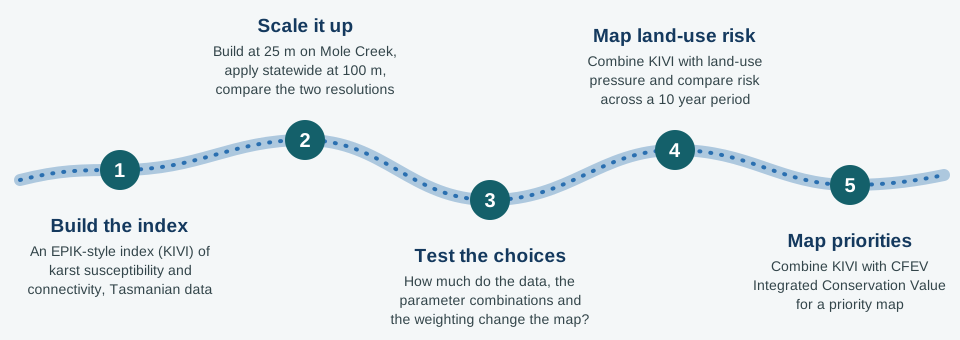
The project in five steps. Diagram drawn by Claude (Anthropic, generative AI) from the authors’ description and checked by the authors.